As a real estate professional, it is important to understand the correlation between key metrics in the market to accurately assess the current state of the industry.
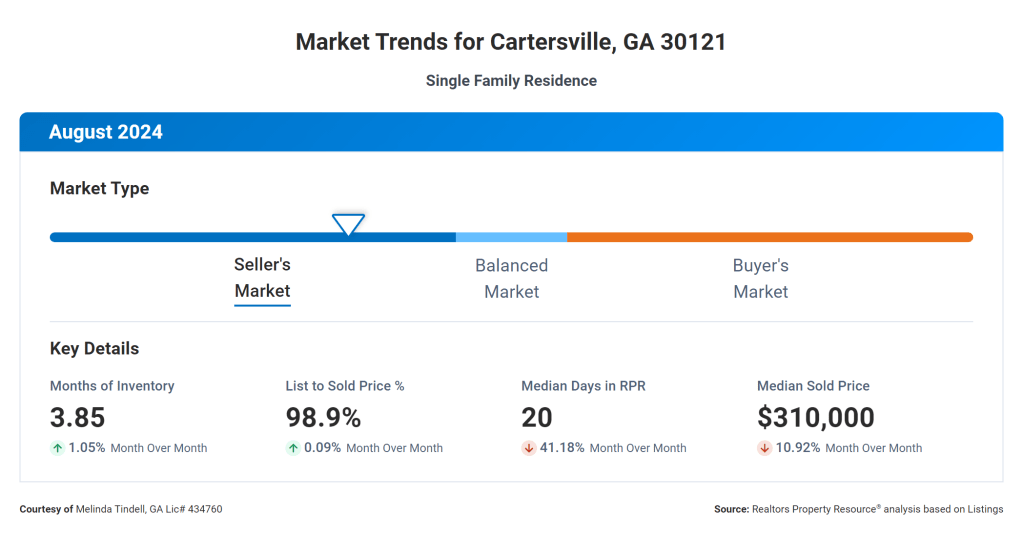
First, let’s look at the Months Supply of Inventory, which is currently at 3.85. This metric indicates how long it would take for all the current homes on the market to sell at the current pace of sales. A lower number typically indicates a seller’s market, where there is high demand and limited supply.
Next, the 12-Month Change in Months of Inventory has increased by 54%. This suggests that the market may be shifting towards a more balanced or buyer’s market, as there is a greater supply of homes available compared to the previous year.
The Median Days Homes are On the Market is 20, which is relatively low. This indicates that homes are selling quickly, likely due to high demand and competitive pricing.
The List to Sold Price Percentage is at 98.9%, which means that homes are generally selling close to their listing price. This is a positive sign for sellers, as it indicates strong buyer interest and a competitive market.
Lastly, the Median Sold Price is $310,000. This is a key indicator of the overall health of the market and suggests that home prices are stable or increasing.
Overall, these metrics paint a picture of a dynamic real estate market with strong buyer demand, limited inventory, and competitive pricing. Buyers should be prepared to act quickly and make strong offers, while sellers can expect their homes to sell relatively quickly and close to their asking price. It is important for both buyers and sellers to work with a knowledgeable real estate agent to navigate the current market conditions and achieve their real estate goals.
If you need help navigating the real estate market, don’t hesitate to give me a call, send a text, or send an email! I am happy to help sell or purchase a home!
Melinda Tindell Phone: 678-956-0454 Email: mtindellrealestate@gmail.com


Leave a comment